 NERC Data Catalogue Service
Fluvial sediments
Type of resources
Available actions
Topics
Keywords
Contact for the resource
Provided by
Years
Formats
Representation types
Update frequencies
Service types
Scale
Resolution
-
Dataset of mineral occurrences in the UK including locations of known mines, mineral showings and localities, including sites where minerals of economic interest have been identified in panned concentrates. Data is normally taken from published sources or from internal BGS records, such as field sheets, rock and stream sediment collection cards. Data compilation started ca. 1994.
-
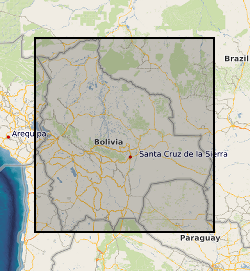
The data in this file represent measurements of the the depth, grain size characteristics and sedimentation rate for sediment cores collected from the floodplain of the Rio Beni in 2011, 2012, and 2013. The age of floodplain sediments was determined from measurements of the Pb-210 activity of floodplain sediments within the cores. The sample collection and laboratory techniques and data analysis procedures used to obtain these data are described in: Aalto, R & Nittrouer, C.A. (2012) Phil. Trans. Royal. Society., vol 370, p 2040-2074. This is an ascii text comma delimited file. Each row in the file represents a sediment core. The file contains 12 columns of data representing: column 1: The core name column 2: The latitude of the core location in digital degrees column 3: The longitude of the core location in digital degrees column 4: The year in which the core was collected column 5: The depth of the floodplain core (in cm) column 6: The age of the oldest sediment in the core (in years) column 7: The depth to the oldest sediment in the core (in cm) column 8: The estimated mean sedimentation rate for the core (in cm per year) column 9: The percentage of the core comprised of clay column 10: The percentage of the core comprised of silt column 11: The percentage of the core comprised of sand column 12: The mean density of sediment in the core (in g per cubic cm)
-
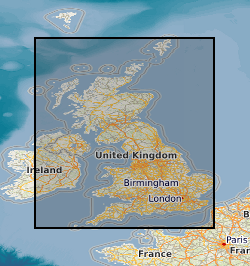
THIS DATASET HAS BEEN WITHDRAWN **This dataset was created for the "Britain beneath our feet" atlas using information extracted from the Geochemical Baseline Survey Of The Environment (G-BASE) For The UK . For Copper in Stream Sediment data please see Geochemical Baseline Survey Of The Environment (G-BASE) For The UK ** Geochemical Baseline Survey Of The Environment (G-BASE) coverage for copper in stream sediment. The G-BASE programme involves systematic sampling and the determination of chemical elements in samples of stream sediment, stream water and, locally, soil, to build up a picture of the surface chemistry of the UK. The average sample density for stream sediments and water is about one site per 1.5-2km square. Analytical precision is high with strict quality control to ensure countrywide consistency. Results have been standardised to ensure seamless joins between geochemical sampling campaigns. The data provide baseline information on the natural abundances of elements, against which anomalous values due to such factors as mineralisation and industrial contamination may be compared. Published in Britain beneath our feet atlas.
-

THIS DATASET HAS BEEN WITHDRAWN **This dataset was created for the "Britain beneath our feet" atlas using information extracted from the Geochemical Baseline Survey Of The Environment (G-BASE) For The UK . For Uranium in stream sediment data please see Geochemical Baseline Survey Of The Environment (G-BASE) For The UK ** Geochemical Baseline Survey Of The Environment (G-BASE) coverage for Uranium in stream sediment. The G-BASE programme involves systematic sampling and the determination of chemical elements in samples of stream sediment, stream water and, locally, soil, to build up a picture of the surface chemistry of the UK. The average sample density for stream sediments and water is about one site per 1.5-2km square. Analytical precision is high with strict quality control to ensure countrywide consistency. Results have been standardised to ensure seamless joins between geochemical sampling campaigns. The data provide baseline information on the natural abundances of elements, against which anomalous values due to such factors as mineralisation and industrial contamination may be compared.
-
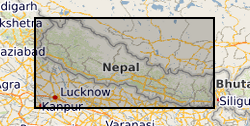
Cation, anion and Sr isotope data from Nepalese river water. Suspended sediment concentration, suspended sediment chemistry presented as wt% oxides from Nepalese rivers. Both the waters and sediments were collected following the 2015 earthquakes.
-

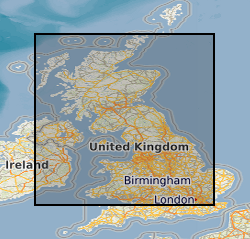
This layer of the map based index (GeoIndex) shows the locations where stream sediment samples are collected under the G-BASE (Geochemical Baseline Survey of the Environment) programme at an average density of approximately one site per 1.5 km square. Analytical data for the minus 150 micron fraction of stream sediment samples are available for some or all of the following elements by a variety of analytical methods (now predominantly XRFS): Mg, P, K, Ca, Ti, Mn, Fe, V, Cr, Co, Ba, Ni, Cu, Zn, Ga, As, Se, Rb, Sr, Y, Zr, Nb, Mo, Pb, Bi, Th, U, Ag, Cd, Sn, Sb, Cs, La, Ce, Ge, Sc, Se, Br, Hf, Ta, W, Tl, Te and I. Stream sediment samples were also collected by the now defunct MRP programme and analytical data for the minus 150 micron fraction of samples is available for a variety of elements including Ag, As, Au, Ba, Bi, Ca, Ce, Cu, Fe, Mn, Mo, Ni, Pb, Sb, Sn, Sr, Ti, U, V, W, Zn and Zr. Some of the MRP samples may have undergone several stages of analysis, some for inclusion in the G-BASE project. The samples may have been assigned a different sample number but will plot at the same site. Data is available for most Great Britain, apart from some parts of Southern England which have yet to be surveyed.
-
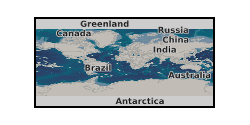
Paired water and river sediment samples were collected from Vietnam Australia, Cambodia and Nepal. Waters were analysed for major ions, Sr isotopes and Mg isotopes. Sediments were sequentially extracted using ammonium chloride, acetic acid and hydrochloric acid to target exchangeable ions, calcite and dolomite respectively. They were analysed for major ions and selected isotopes.
-
Data from the British Geological Survey's GeoIndex Geochemistry theme are made available for viewing here. GeoIndex is a website that allows users to search for information about BGS data collections covering the UK and other areas world wide. Access is free, the interface is easy to use, and it has been developed to enable users to check coverage of different types of data and find out some background information about the data. More detailed information can be obtained by further enquiry via the web site: www.bgs.ac.uk/geoindex.
-

The G-BASE programme involves systematic sampling and the determination of chemical elements in samples of stream sediment, stream water and soil, to build up a picture of the surface chemistry of the UK. The average sample density for stream sediments and water is about one site per 1.5-2km square, and for soils one site per 2km square. Analytical precision is high with strict quality control to ensure countrywide consistency. Results have been standardised to ensure seamless joins between geochemical sampling campaigns. The data provide baseline information on the natural abundances of elements, against which anomalous values due to such factors as mineralisation and industrial contamination may be compared. Analytical data for the 150 microns fraction of soil and stream sediment samples are available for some or all of: Ag, As, B, Ba, Bi, Be, Ca, Ce, Cd, Co, Cr, Cs, Cu, Fe, Ga, K, La, Li, Mg, Mn, Mo, Nb, Ni, P, Pb, Rb, Sb, Se, Sn, Sr, Th, Ti, U, V, Y, Zn, and Zr. Most water samples have been analysed for alkalinity, pH, conductivity, F and U and some for multi-element analyses including Al, Cl, Na, Si, SO4,NO4, and TOC. The project now routinely determines the elements listed in the <2mm fraction of surface soils.
-
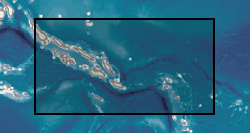
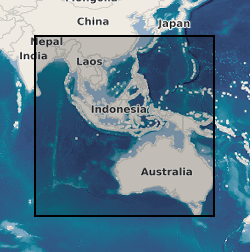
Two geochemical surveys were undertaken in the Solomon Islands between 1976 and 1983 as part of a combined geological mapping and mineral exploration project. The survey of Choiseul and the Shortland Islands was carried out between 1976 and 1979 by the Institute of Geological Sciences (now the British Geological Survey) with support from staff of the Geology Division of the Ministry of Land, Energy and Natural Resources, Solomon Islands. The project produced 12 geological maps at 1:50,000 scale as well as a series of unpublished reports. The survey of the New Georgia Group of islands was undertaken between 1979 and 1983. The project produced 7 geological maps at a scale of 1:100,000 and a regional map of the entire island group at a scale of 1:250,000. A series of multielement geochemical anomaly maps were produced at a scale of 1:100,000 to accompany each of the published geological maps. Master copies of these are held at the Geological Survey in Honiara. Full descriptions of the methods used are described in the margins of the anomaly maps. A total of 8848 stream sediment samples were collected from Choiseul and 7441 from the New Georgia Group, resulting in an average sampling density for the two areas of 2.68 samples per km2 and 1.47 samples per km2 respectively. Sampling in the Shortland Islands was confined to the larger islands, 187 were collected from the Fauro Island group, 148 from Alu and 69 from Mono. The samples were dry sieved and the fraction passing -80 mesh B.S. (177 microns) was analysed. A hot concentrated nitric acid digestion was used prior to analysis by atomic absorbtion spectrophotometry (AAS) for Co, Cu, Pb, Zn, Ni, Ag, and Mn. Samples from the vicinity of the Siruka Ultramafic Complex were determined for Cr by AAS after digestion by a bisulphate fusion technique. Raw data can be obtained from the Geology Division, Ministry of Mines and Energy, PO Box G37, Honiara, Solomon Islands.